Benchmarking Report Format for Longevity Clinics
Build a benchmarking report format for longevity clinics: nine parts, four-axis scoring, KPI rules and disclosures that keep comparisons auditable.
The popular advice on benchmarking report format starts with an executive summary and ends with a dashboard. That’s not enough for longevity clinics. A polished report can still mislead if it ranks a residential medical stay against an outpatient diagnostic day without showing which measures are comparable.
The better starting point is a comparability warning beside every KPI, not a caveat buried in the appendix. Readers should be able to follow the measurement, recognise the editorial judgement, and decide what the comparison can support.
Table of Contents
- The Nine Parts of a Benchmarking Report
- Why a Ranking Is Not a Benchmark
- Five Content Categories to Keep Separate
- Methodology Scope and the Data Dictionary
- Building a 0 to 100 Four-Axis Score
- KPI Rows and Comparability Warnings
- How Later Sections Point Backward
- Quick Lookup Before You Trust a Report
- Applying the Format as Writer or Chooser
The Nine Parts of a Benchmarking Report
| Component | Reader question | Minimum content |
|---|---|---|
| Executive summary | What changed and for whom? | Peer group, composite range, decision-changing gaps only |
| Methodology | How was the comparison built? | Inclusion, geography, programme type, review date, missing data, scoring rules |
| Data scope and definitions | What is being compared? | Unit of analysis, period, data dictionary pointer |
| KPI comparison tables | Where does each clinic stand? | Clinic value, benchmark value, absolute gap, relative gap, source |
| Visual dashboards | What should I see first? | Same KPIs, targets, thresholds, last refresh |
| Gap analysis | Is the gap real? | Performance versus format or case-mix |
| Recommendations | What should change? | Actionable findings and explicit non-inferences |
| Owner-assigned actions | Who follows up? | Owner, deadline, target; owner may be blank in a public ranking |
| Appendix | Can I audit this? | Raw values, exclusions, validation notes, robustness checks |
The nine-component structure described in BizMiner’s benchmarking report examples separates measurement, interpretation and action, and supports a five-step cycle of planning, selecting peers, collecting data, analysing gaps, and implementing and monitoring. The report should preserve the record of that cycle, rather than function as a one-off dashboard.
Start with the decision, then expose the method
The executive summary identifies the peer group and the findings that could change a decision. It shouldn’t introduce a headline score, range or claim that readers can’t locate in the detailed results.
Methodology follows because readers need to know how the comparison was built before accepting its conclusions. State the inclusion rules, geography, programme formats, review date and scoring procedure. Make missing-data treatment visible here, not after the rankings.
Data scope then fixes the object being assessed. A named programme at a named site during a specified reporting period is more useful than an undefined clinic brand that might operate different services across locations.
The KPI tables provide the evidence-bearing comparison. Dashboards should repeat that evidence in a more accessible form, with the same definitions and ordering. A chart must never introduce an attractive metric that the underlying table doesn’t contain.
Separate findings from follow-through
Gap analysis asks whether an observed difference reflects performance or a different service model. Recommendations translate supported gaps into proposed changes, while stating what the evidence doesn’t justify.
For an operator, owner-assigned actions turn those proposals into responsibilities. The appendix preserves the details needed to challenge or reproduce the result.
- For internal reports, retain the full gap, recommendation and action sequence so managers can assign work and monitor progress.
- For public rankings, shorten operational recommendations where appropriate and leave an internal owner unnamed rather than inventing accountability.
- For both audiences, keep exclusions, validation notes and raw evidence available even when the main report is concise.
A reader may only need the summary. The format still needs to let that reader work backwards to the underlying observation.
Why a Ranking Is Not a Benchmark
A sorted list of clinic scores isn’t a benchmark. It tells readers who appears above whom, but it may say nothing about the reference population, the measurement rules or whether the programmes belong in the same comparison.
A benchmarking report documents a structured comparison against a named reference point. Anyone opening it should be able to identify the included programmes, the meaning of each indicator, the reporting period and the reasoning behind the conclusion.
That distinction matters when service labels overlap. A residential programme may incorporate accommodation and repeated appointments. An outpatient service may concentrate investigations into a diagnostic visit, while a membership may promise continuing access rather than a defined episode of care.
Keep observation, judgement and action apart
Consider a programme advertising an extensive laboratory panel. The observation is that the clinic publicly lists certain investigations. The editorial judgement concerns what those investigations contribute under the rubric. The action might be to investigate whether clinically interpreted results and follow-up are included.
Those are different statements. A test list alone doesn’t establish diagnostic quality, and a score for diagnostic characteristics doesn’t establish improved patient outcomes.
A ranking answers who placed higher. A benchmark should also explain what was measured, against whom, and under which rules.
Weak formats hide predictable problems: identically named panels containing different investigations, averages drawn from mismatched peers, and composite scores that move because an editor changed the formula.
Readers examining longevity clinic reviews should therefore distinguish an assessment of documented programme characteristics from proof of clinical effectiveness. A useful review can support a purchasing decision without claiming to predict an individual patient’s result.
Keep the report’s reading order stable across publication cycles. Otherwise, readers must decipher a redesigned presentation before they can determine whether the clinic itself changed.
Five Content Categories to Keep Separate
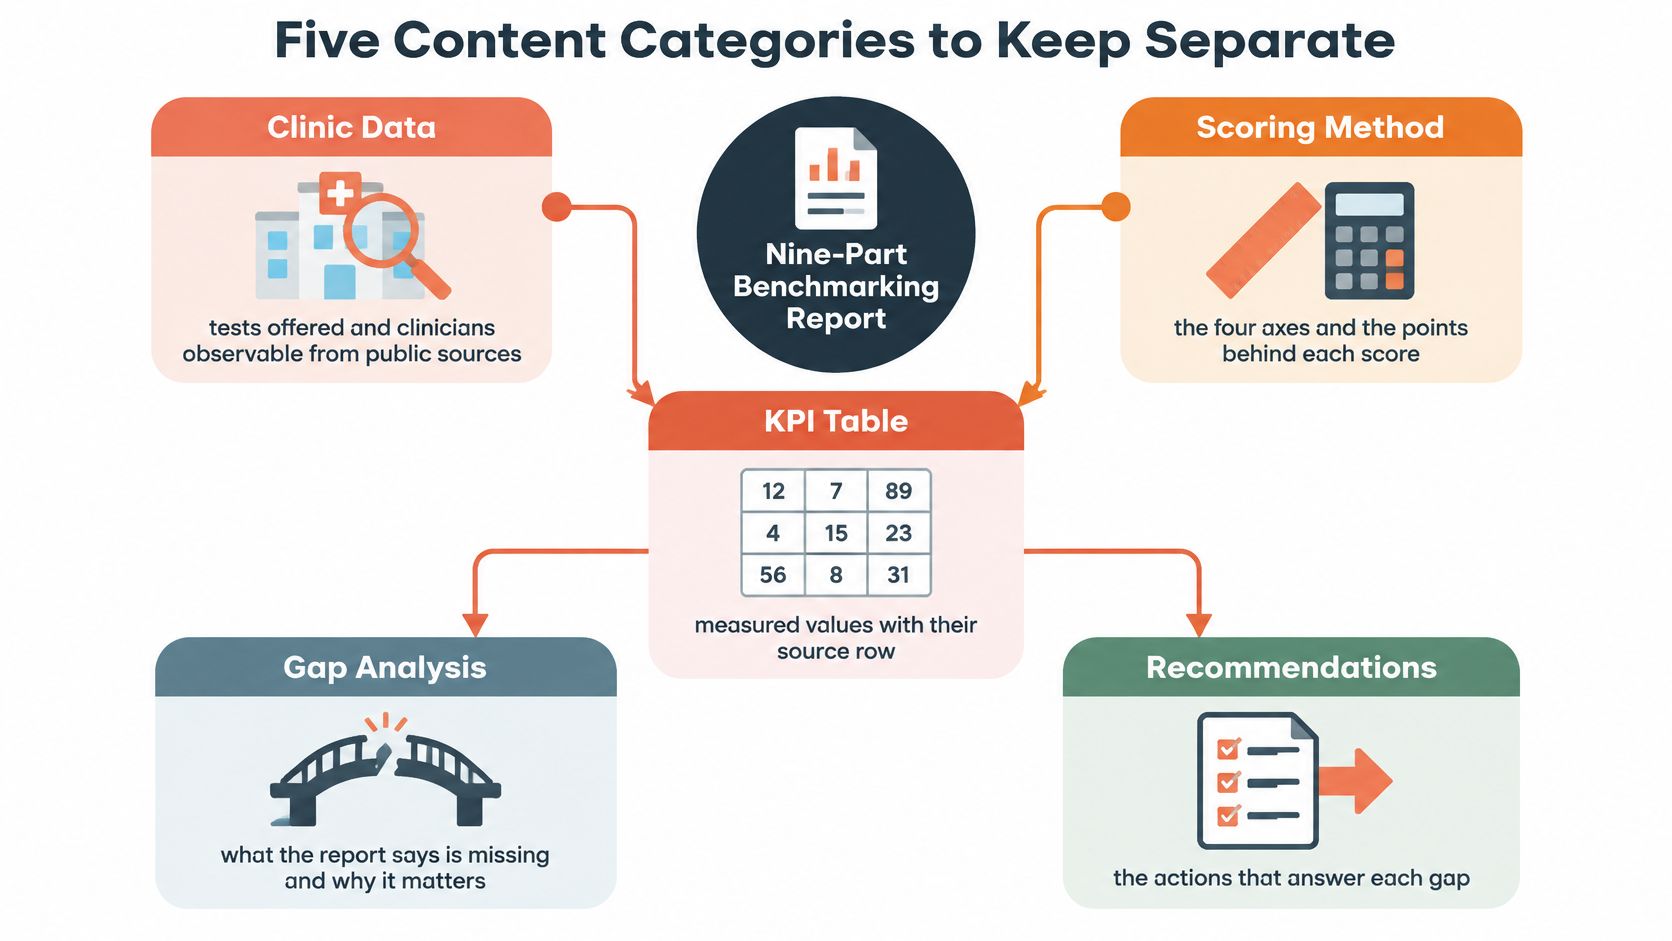
A clinic’s fee model isn’t a quality finding. A scoring weight isn’t an observed fact. Sorting information into distinct categories prevents these errors before they reach the report.
The diagram shows how observed information feeds scoring, tables, interpretation and recommendations. Keep the underlying editorial categories separate even when those materials appear together on a page.
Facts and comparison rules
Clinic data records observable characteristics: investigations offered, clinician roles, programme duration, location, regulator and follow-up model. Label the care format alongside those facts.
A common misfile is treating a clinic’s claim of extensive testing as a scoring conclusion. Record the offering first; assess it separately.
Comparison criteria determine which programmes can fairly be evaluated together. Format, region, patient acuity where known, and reporting period belong here. Hiding a membership fee model inside a quality KPI confuses the comparison boundary with performance.
Scoring converts eligible observations into editorial assessments. It contains preferred directions, weights and aggregation rules. Placing an unsupported marketing adjective in a score cell disguises promotional language as measurement.
Procedure and limitations
Methodology explains how analysts obtained, checked and processed information. Disclosures explain the report’s interests and limits.
| Category | What belongs there | Example of a misfile |
|---|---|---|
| Methodology | Collection procedure, quality labels, missing-value treatment and reproducible calculations | Reporting an unavailable indicator as poor performance without a declared rule |
| Disclosures | Funding, advance access, estimates and restrictions on comparison | Burying a financial relationship in a technical calculation note |
Keep operational characteristics, outcome-related measures and contextual factors in distinct blocks. They can inform the same decision without becoming interchangeable evidence.
The scope statement and dictionary hold the clinic facts and procedural definitions. The peer-group specification holds comparison criteria, while the scoring protocol contains editorial conversions. Disclosures should remain easy to find beside the results they qualify.
This separation also helps editors resolve disagreements. If an analyst challenges a weight, that’s a scoring issue. If a clinician questions what a panel includes, that’s a definition and evidence issue. They shouldn’t be settled by rewriting the same cell.
Methodology Scope and the Data Dictionary
Open the methodology with the unit of analysis: a named programme, at a named site, in a declared format and review period. Don’t let a brand-wide description stand in for a particular service.
ISO 17258 treats the benchmark as the reference point for comparison and calls for explicit criteria, including an explanation when a criterion is excluded. Use that discipline to make scope decisions visible rather than leaving readers to infer them.
Specify eligibility before collecting scores
Write inclusion and exclusion rules as conditions an analyst can apply. A programme might need a sufficiently documented service scope to enter an axis, while a discontinued offering belongs outside the current comparison.
Define the reference population just as carefully. Outpatient programmes within a declared region and reporting period offer an interpretable peer group. A global average shouldn’t be the only reference for services with materially different obligations.
Each KPI needs a dictionary entry containing:
- Meaning and calculation: Name, plain-language definition, formula, unit and preferred direction.
- Evidence and timing: Source type, collection date, refresh cycle and quality status.
- Governance: Definition owner, eligibility threshold and aggregation rule.
- Exceptions: Missing-data treatment, outlier handling and non-comparable observations.
Use separate labels for independently verified, clinic-stated and editor-estimated information. A clinic webpage is evidence of what the clinic states, not independent confirmation that the service was delivered.
Work through diagnostic depth
For diagnostic depth, specify whether the indicator counts tests offered, routinely performed or clinically interpreted. State whether follow-up is included and how overlapping panels are handled.
These definitions produce different observations. Counting every item in a brochure cannot substitute for counting investigations reviewed by a clinician.
Definition rule: If an analyst can’t tell whether a test qualifies without asking the original scorer, the dictionary isn’t complete.
Declare missing-value rules before scoring. You may exclude an insufficiently documented axis or apply a declared cap, but you shouldn’t invent a value. Likewise, select an outlier procedure in advance and preserve both the original observation and any transformed value.
Our published methodology provides a disclosed reference for this process. At Longevity Clinics, we collect publicly available information from clinic websites, regulator records, peer-reviewed literature and professional registries, then score it algorithmically and have physicians and editors validate every result.
Medical reviewers check every clinical claim before publication. Reviews carry an Editorial team byline, and no single reviewer’s judgement sets a score.
Record each definition’s last refresh and responsible role. If its meaning changes between editions, log a methodology revision, not a clinic improvement.
Building a 0 to 100 Four-Axis Score
A composite score is an editorial model, not a naturally occurring property of a clinic. Readers need the component assessments to understand what the total means.
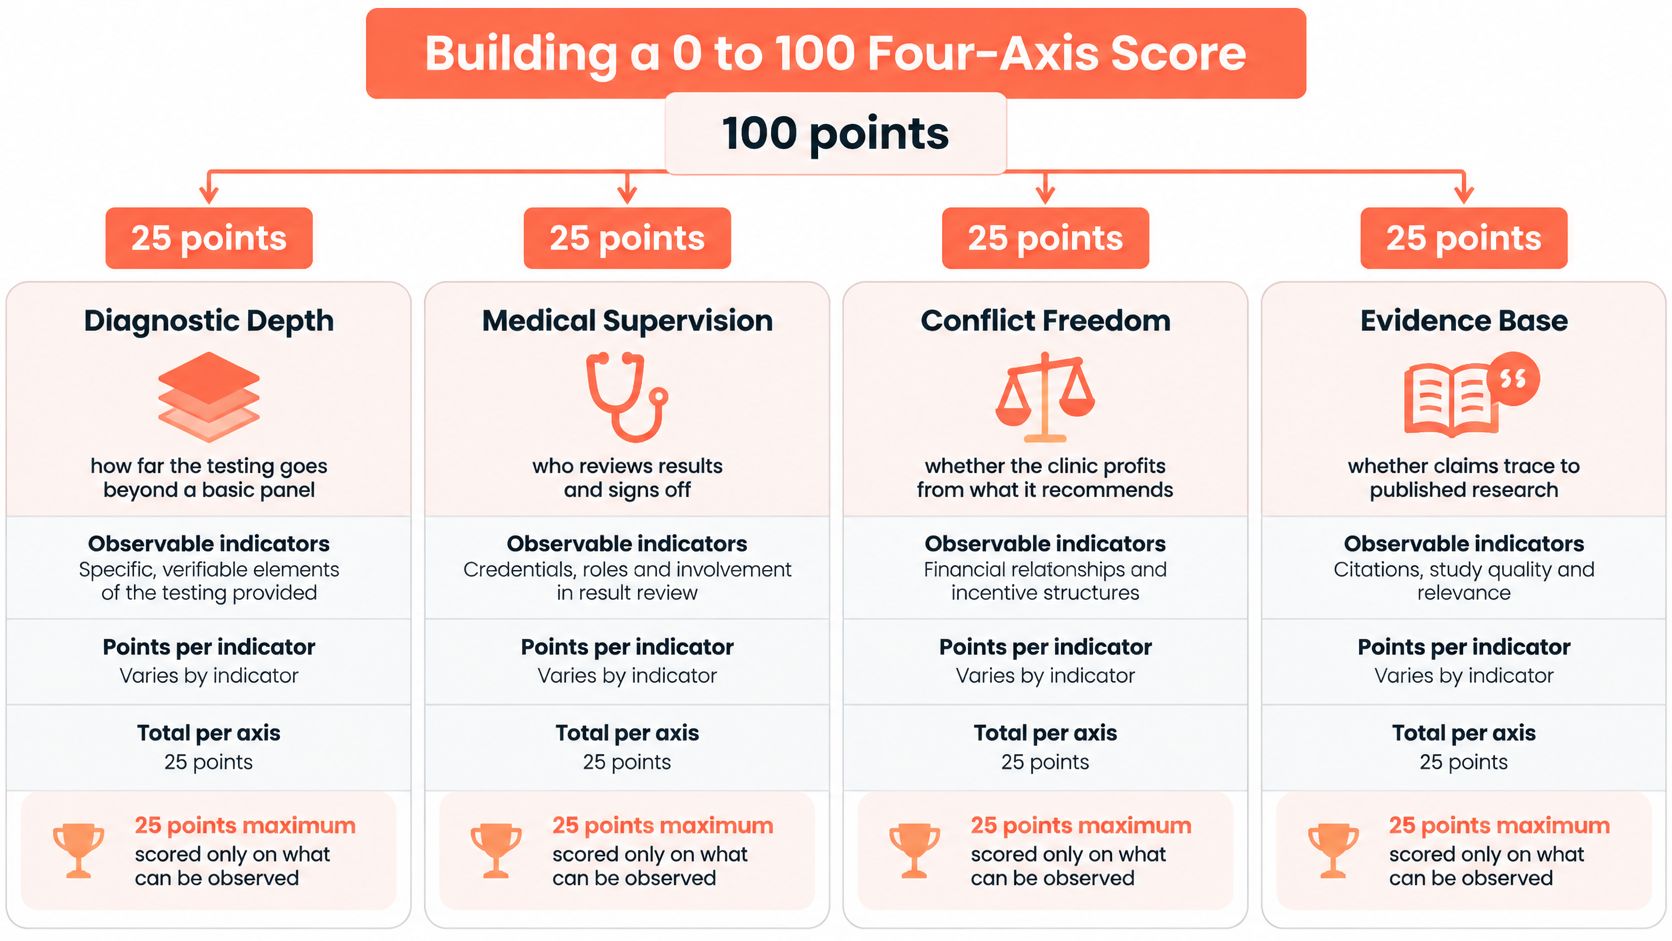
At Longevity Clinics, each clinic is assessed across four axes worth 25 points each. Each review presents the 0–100 composite and its axis breakdown, and every result follows the published methodology.
| Axis | Points | Example observable indicators | Preferred direction |
|---|---|---|---|
| Diagnostic depth | 25 | Tests offered, routinely performed or clinically interpreted; whether follow-up is counted | Higher preferred within clinically justified definitions |
| Medical supervision | 25 | Clinician roles, clinician hours per patient, follow-up model | More appropriate, documented clinical oversight |
| Conflict freedom | 25 | Incentive structure and disclosure of sales-linked revenue | Higher freedom from conflicts preferred |
| Evidence base | 25 | Share of modalities labelled experimental; evidence labels applied | Declare per indicator |
The indicators in this table illustrate what a rubric must operationalise. They don’t justify awarding points merely because a programme offers more tests, more appointments or more interventions.
Make the arithmetic reproducible
The OECD and European Commission handbook on composite indicators3/en/pdf) explains why normalisation, weighting and aggregation require explicit choices, and why alternative methods can produce different rankings. Publish raw observations beside normalised results so readers can inspect those choices.
For each axis, freeze the formula, component weights, eligibility rules, floor, cap, rounding convention and tie treatment. An equal-weighted mean of eligible normalised indicators is a possible design, but it must be identified as the chosen rule rather than assumed.
A reproducible specification should also explain:
- Direction: Whether a higher observation is preferred, a lower observation is preferred, or a justified range is preferred.
- Transformation: How skewed variables are handled before aggregation.
- Ties: Whether equal displayed scores receive shared rank rather than an arbitrary ordering.
Don’t equate more testing with better care. A diagnostic indicator needs clinically justified eligibility rules before a higher qualifying value can sensibly earn more points.
Test the result rather than admire it
In a hypothetical illustration, not clinic data, suppose diagnostic depth earns 22 points, medical supervision 20, conflict freedom 9 and evidence base 18. The arithmetic gives a composite of 69 out of 100.
That total conceals an important weakness if described as uniformly strong. The conflict-freedom result needs to remain visible beside the composite.
An appendix on sensitivity should rerun the model using alternative weights, another normalisation method and the removal of individual indicators. Report the resulting rank range or score interval when those choices materially affect placement.
Small displayed gaps shouldn’t become confident claims of superiority without repeatability evidence. Scores remain editorial assessments of available information, can change as public evidence changes, and require validation rather than deference to a single reviewer.
KPI Rows and Comparability Warnings
| Measure | Example unit | Comparability class | Presentation rule |
|---|---|---|---|
| Follow-up completion | Percent of patients with a scheduled review done | Directly comparable | Rank across formats if the obligation exists for all |
| Clinician time | Hours per patient | Context-adjusted | Rank only inside the same care format |
| Cost intensity | Cost per clinical day | Context-adjusted | Don’t rank sticker price across formats |
| Diagnostic volume | Count of tests offered | Unsuitable for cross-format ranking | Show as structure; don’t add it raw into a league table |
| Programme length | Residential nights or membership months | Unsuitable for cross-format ranking | Use only to define the peer group |
| Evidence label | Share of modalities marked experimental | Directly comparable | Compare the label, not the marketing name of the modality |
Treat these classes as presentation rules, not optional annotations. Every KPI receives a class, and the class determines whether the reader sees a cross-format rank, a within-format comparison or contextual information only.
BizMiner’s custom benchmarking guidance supports qualifying comparison data and considering financial, operational and quality measures together. For clinic reporting, that means defining peers by care format, geography, patient risk where known, and reporting window before interpreting differences.
Put the warning beside the value
Directly comparable requires matching units, definitions and obligations. Follow-up completion qualifies only when all included programmes owe patients the relevant follow-up and use the same eligibility and completion rules.
Context-adjusted means the raw value needs restatement. Clinician time per patient is more informative than a staff headcount, but programme duration and patient needs can still restrict comparison to a format-specific peer group.
Unsuitable for cross-format ranking means display without rank contribution. Residential nights describe the service structure; they don’t demonstrate better clinical value.
A higher test count can reflect a longer stay rather than better clinical value.
Print that warning beside diagnostic volume, not beneath a distant chart. Pair it with an interpretation note explaining that the measure doesn’t establish clinical necessity or benefit.
Build rows that support inspection
Every KPI row needs the indicator name, a short calculation, clinic value, peer median, interquartile range, absolute gap and any valid relative gap. Include the reporting window, source label, definition owner, threshold and comparability class.
Use a relative gap only for a suitable ratio scale with a meaningful, non-zero reference. For rates, distinguish a percentage-point difference from a relative percentage difference.
- Show distribution: Prefer medians and quartiles to an average alone when high-intensity programmes could distort the apparent typical service.
- Preserve order: Keep scorecards and dashboards in the same KPI sequence across editions.
- Expose eligibility: Show whether the value is admitted to scoring rather than assuming every displayed observation earns points.
The same editorial discipline applies outside healthcare. TheContentMap’s guide to measuring content ROI for editors offers a useful parallel when deciding whether a metric answers the decision being made.
For laboratory measures, diagnostic lab requirements provide relevant context before readers treat similarly named offerings as equivalent.
How Later Sections Point Backward
Cross-references are a rule, not a courtesy. Every executive-summary number should identify its KPI row, and every recommendation should identify the gap it answers.
FanRuan’s KPI dashboard guidance emphasises calculation logic, sources, reporting windows, refresh frequency, thresholds, owners and interpretation. Carry those fields through the report so readers can distinguish changed performance from changed definitions or delayed updates.
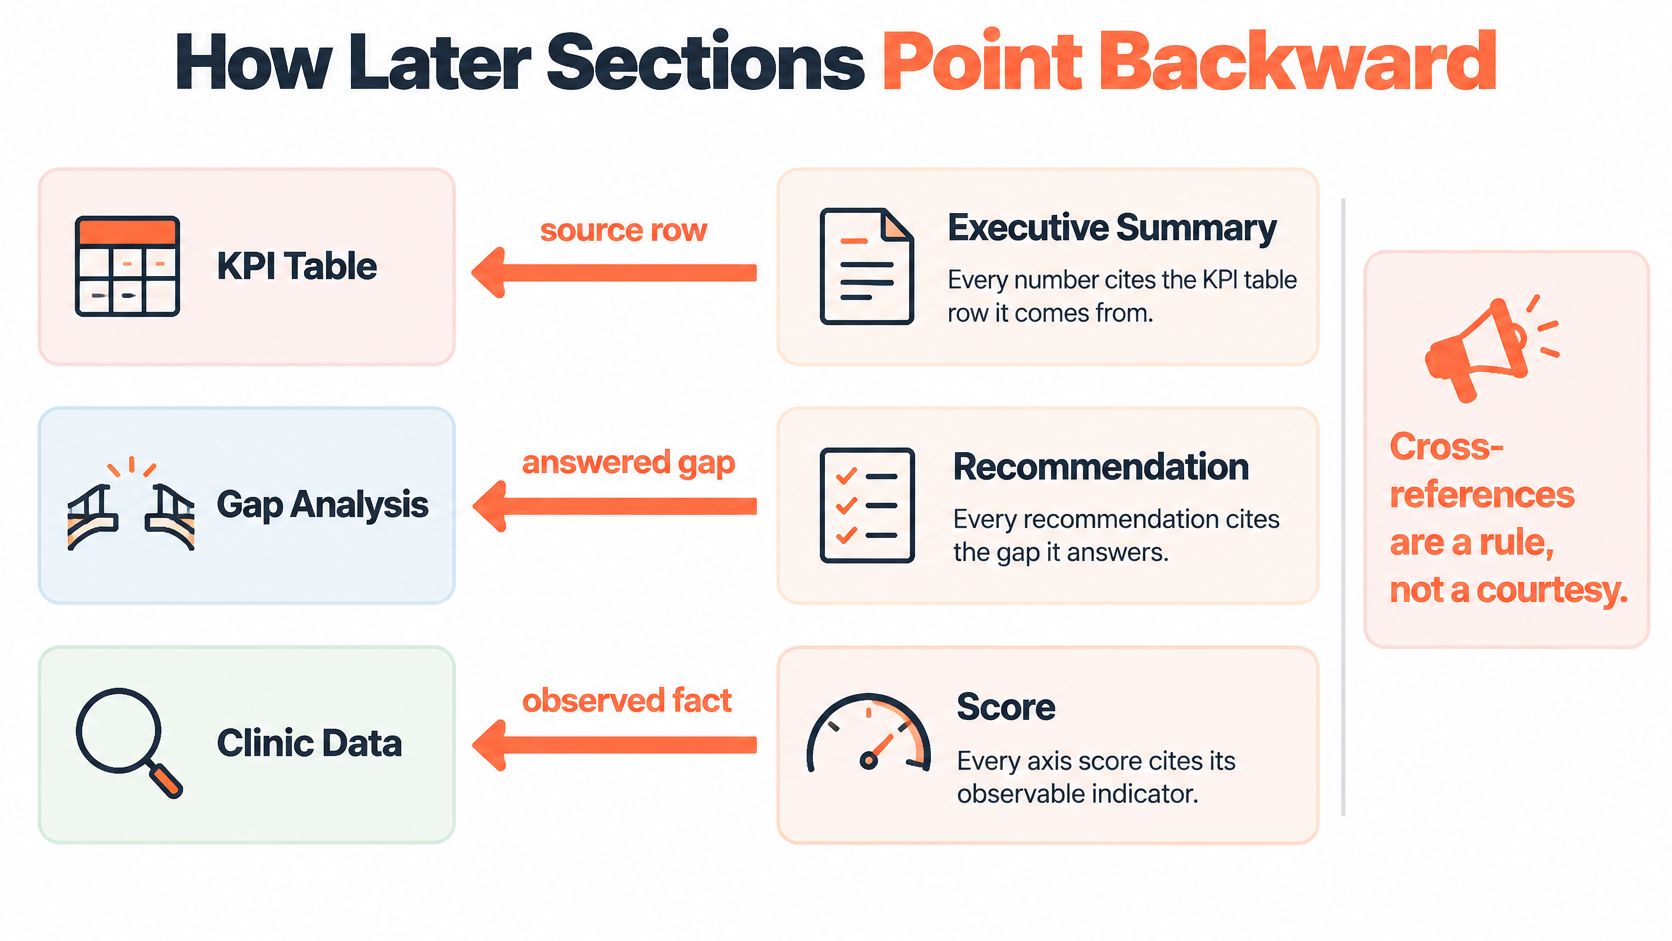
Follow a finding through the report
Suppose a summary identifies weak conflict freedom. Its reference should lead to the incentive-structure KPI, where readers can inspect the documented revenue relationship and the rule used to assess it.
The gap statement then gives the observed difference, the peer definition and the measure’s comparability class. A recommendation might call for clearer incentive disclosures if that is the documented deficiency. It shouldn’t imply that a missing disclosure proves improper clinical conduct.
| Report element | Required backward reference |
|---|---|
| Summary finding | KPI identifier and evidence date |
| Gap statement | Observation, defined peers and comparability class |
| Recommendation | The supported gap it addresses |
| Action | Recommendation and matching KPI unit |
| Axis score | Raw indicators, dictionary version and coding record |
The publishing disclosure belongs in this evidence chain too. We don’t contact rated clinics or show them scores before publication. That independence statement explains the editorial process; it isn’t itself evidence about a clinic’s financial incentives.
Make follow-up auditable
An internal action needs an owner, deadline and target expressed in the indicator’s unit. If the gap concerns disclosure completeness, the target should concern the required disclosures, not an unrelated ambition to improve the overall score.
For clinically sensitive recommendations, stay qualitative unless the indicator has a declared and defensible direction of preference. Where a measure is unsuitable for ranking, describe the difference without recommending that a clinic imitate another care format.
- Use stable identifiers: Give indicators persistent anchors so references survive layout changes.
- Keep exceptions visible: Place non-comparable fields, regulatory uncertainty and experimental modalities in a consistently located risk block.
- Preserve audit links: Connect each score to its evidence date, dictionary version, completeness indicator and resilience record.
A reader should be able to move from a claim to the coding decision without rereading the entire methodology.
Quick Lookup Before You Trust a Report
Apply the following checks to a published benchmark or an internal draft. Mark Yes only when the required information is visible, not when the publisher says its process is rigorous.
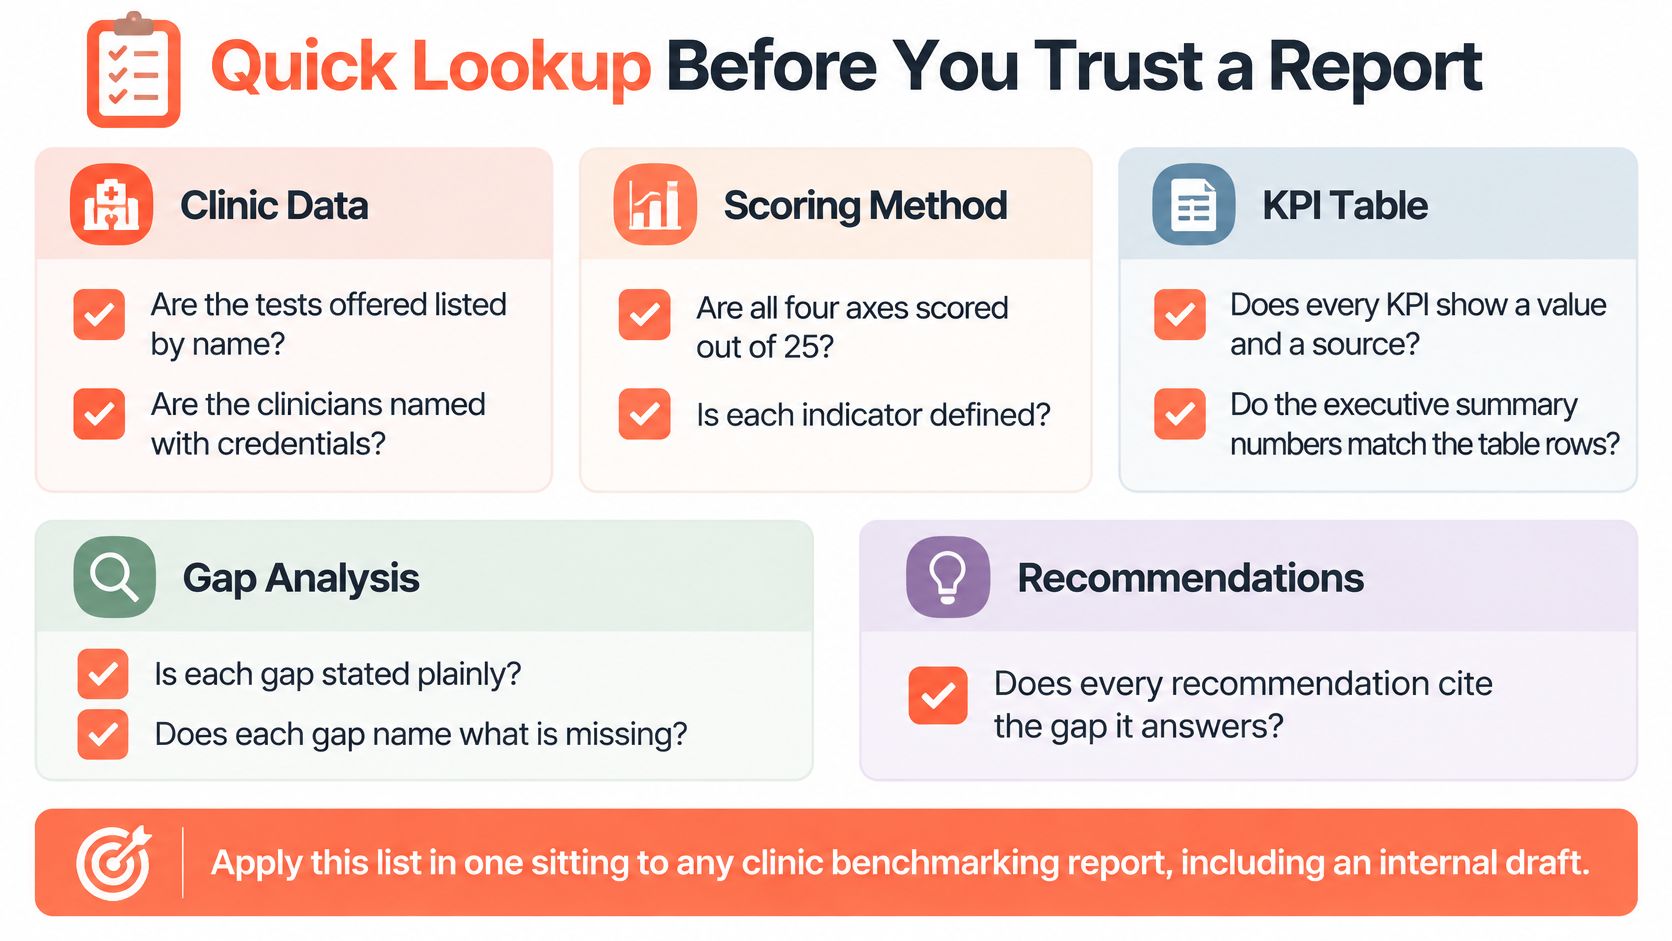
Check the evidence and calculation
| Category | Check | Result |
|---|---|---|
| Clinic data | Format labelled as residential, outpatient or membership | Yes / No |
| Clinic data | Geography named and review date visible | Yes / No |
| Clinic data | Each figure labelled verified, clinic-stated or estimated | Yes / No |
| Comparison | Peer group defined by format and reporting period | Yes / No |
| Comparison | Median and quartiles shown, not only a mean | Yes / No |
| Scoring | Composite and all four axis scores present, with weights stated | Yes / No |
| Scoring | Raw values shown beside normalised scores; tie and rounding rules stated | Yes / No |
| Scoring | Small score gaps aren’t presented as findings without uncertainty evidence | Yes / No |
| Methodology | Missing-data and outlier rules written before results | Yes / No |
| Methodology | Definition changes logged against the prior edition | Yes / No |
| Disclosures | Funder named; statement that rated clinics did not pre-clear scores | Yes / No |
| Disclosures | Experimental modalities labelled; comparability warning on each KPI | Yes / No |
A No identifies something to resolve before relying on the comparison. It doesn’t automatically prove the underlying service is poor, because reporting quality and clinical performance aren’t identical.
Check how you can challenge or quote it
A credible format also gives readers a route to correct an observation. If one of our profiles is out of date or contains an incorrect figure, send the supporting source through the factual-correction contact option. We fix factual errors and note the change on the page.
- For quotations: Our published permission allows excerpts of up to 200 words, with a link back to the source page.
- For factual disputes: Supply the affected statement and evidence that supports the correction.
- For scoring disputes: Use the methodology or scoring question option when the issue concerns a rule rather than a factual observation.
Keep those requests separate. A corrected fact may affect a score, but disagreement with an editorial judgement isn’t proof that the recorded fact is wrong.
Don’t use a report to choose a programme if it fails the peer-group check or omits comparability warnings, even when its composite looks precise. Numerical presentation can’t repair an undefined comparison.
Applying the Format as Writer or Chooser
If you’re writing a report, fix the report structure and comparability classes before gathering more clinic facts. Don’t admit a KPI without a dictionary entry, and don’t publish a score whose component evidence, observation date and exclusions you can’t show.
If you’re choosing a programme, reject a composite presented without its axis breakdown and eligibility context. Read the measurement rules before comparing care formats, then assess whether the documented service matches the decision you’re making.
Check independence alongside the arithmetic
A transparent benchmarking report format also explains who pays and who controls publication. At Longevity Clinics, reader subscriptions and a separately managed industry benchmark report fund the service; neither revenue stream influences editorial coverage.
Clinics may purchase our annual industry benchmarking report but cannot influence it. The report is editorially walled off from the directory, and the people running the scoring engine don’t see its customer list.
Those arrangements don’t replace measurement scrutiny. They give readers additional facts with which to assess the independence of the process.
- Writer’s decision rule: Withhold a conclusion when the evidence trail cannot support it.
- Chooser’s decision rule: Compare the service obligations you need, not merely the displayed totals.
Before shortlisting a programme, open our comparison view, inspect the axis breakdowns and read the methodology for any cross-format comparison. If a public-source fact appears wrong, send the supporting evidence through our factual-correction option; if the uncertainty concerns weighting or eligibility, submit a methodology question so the issue can be assessed on its own terms.