Biological Age Testing: How to Read Results
Biological age testing compares clocks, proteins, and telomeres. See what each score means, the error range, and the report minimum before you change care.
The most popular advice about biological age testing is to get tested, find your number, then drive that number down. That advice fails at the very first step, because the number isn’t one number. Two people can send blood to two labs on the same morning and receive results that disagree by a decade, and neither lab has made an arithmetic error. They measured different things.
Say a 52-year-old orders two kits. One report comes back at 44. The other comes back at 61. Both are internally consistent, both come from a real assay, and neither tells you whether that person is ageing quickly. What separates them is the algorithm behind each score and the outcome that algorithm was trained to predict.
So the useful question isn’t “what is my biological age”. It’s “which of three outputs is this report giving me, and how large is the error around it”. Those outputs are a calendar residual, a mortality marker, and a pace. A clinic that can’t say which one it’s selling has handed you a number, not a finding.
Table of Contents
- What a Biological Age Score Claims
- How the Main Tests Differ
- When a Precise Clock Still Misleads
- What One Result Means for You
- Accuracy Across Ancestry and Circumstance
- Choose a Report Minimum Before You Pay
What a Biological Age Score Claims
Chronological age counts years lived. A biological age test counts only what its training data taught it to count, whether that means methylation sites, proteins, metabolites, telomeres, or a standard lab panel. The result arrives formatted like a birthday, which is why readers file it next to their date of birth.
The field’s origin explains the confusion. Steve Horvath’s 2013 paper, DNA methylation age of human tissues and cell types, built an epigenetic clock from 353 CpG sites, the locations where methyl groups attach to DNA, and showed the model could estimate chronological age across multiple human tissues and cell types from a blood or tissue sample. That was the milestone, as a 2024 systematic review of epigenetic clocks recounts: an assessment that had lived in physiological theory became a reproducible molecular measurement.
Then the objective split, and the split is where buyers get lost. First-generation models chased the calendar. Later tools such as DNAmPhenoAge and DNAmGrimAge were trained on clinical risk factors, disease-related traits, or mortality outcomes. The same review states the distinction that matters commercially: epigenetic clocks generally estimate chronological age better than they predict mortality, while phenotypic clocks built from routinely measured biomarkers can predict mortality more strongly.
Three outputs hide behind one phrase. A calendar residual shows how far your estimated age sits from your birth certificate. A mortality marker is a relative hazard drawn from population data. A pace is a rate, how fast the model thinks you’re ageing per year. Keep those three apart and most marketing collapses on its own.
The same logic applies to neighbouring metrics. XO’s clinician explanation of metabolic age makes the point cleanly: a computed age is a weighted summary of inputs, not a diagnosis, and it only means something when you know which inputs and which reference range produced it.
An algorithm can estimate your birthday from methylation with real accuracy and still be a weak forecast of whether you’ll see ninety. Precision and prognosis are separate products, and the sales page usually blurs them into one.
How the Main Tests Differ
A biological age report can show a calendar residual, a mortality marker, or a pace. The method determines which output it produces, so check whether the report names the clock and explains what its result represents.
| Method | Built to estimate | Figure to keep | Do not read it as |
|---|---|---|---|
| Horvath clock | Chronological age from methylation | One estimate designed to work across blood and other tissues | A mortality score |
| Hannum clock | Chronological age from blood methylation | A blood-based calendar estimate | The same measure as GrimAge |
| DNAmPhenoAge | Phenotypic age linked to morbidity | A measure trained using clinical risk factors | An exact birthday |
| DNAmGrimAge | Mortality-related traits | A measure trained against mortality outcomes | A personal survival forecast |
| DunedinPACE | Pace of ageing from 173 CpGs | A rate near 1.0 marks the reference pace | Years younger or older |
| Proteomic or metabolomic panel | Lab-specific protein or metabolite patterns | The result from that panel and its reference data | A standardized biological age |
| Telomere length | Average telomere attrition | A population-level pattern, with limited precision for one person | A diagnosis of biological age |
| Clinical phenotypic clock | Age estimated from routine biomarkers | A result based on routine lab measures, without methylation | Proof that lowering the score extends life |
The last column draws the boundary between a measurement and the claim attached to it.
First-generation clocks targeted birthdays. Horvath’s and Hannum’s clocks were trained to estimate chronological age. Hannum’s model was built using blood methylation, so its result is tied to that tissue. Horvath’s clock was designed to work across tissues. Neither was built to estimate mortality. Later findings about mortality associations are evidence about how a clock performs for that outcome, not a change to what it was originally designed to measure, as this review of epigenetic clock generations explains.
Other clocks target risk-related traits. DNAmPhenoAge and DNAmGrimAge incorporate morbidity- or mortality-related measures in their training. Their results are therefore different from a simple estimate of years since birth. A change in clinical markers can also affect the result, so a single reading may reflect a temporary change as well as a longer-term pattern.
DunedinPACE reports speed. It uses 173 CpGs from whole blood and gives a relative rate rather than an age. A value near 1 indicates the reference pace; above 1 indicates a faster pace, and below 1 a slower one.
The conversion trap: A pace of 0.9 does not mean you are ten percent younger. It is a rate, not a number of years gained or lost.
Other panels do not share a common scale. Proteomic and metabolomic tests use different analytes and reference data, so a result from one lab cannot automatically be compared with another lab’s figure. Repeating the same panel can show a trend, but does not make its scale universal.
Telomere length measures average attrition across cells in a sample. It tends to track age across populations, but offers limited precision for an individual. Clinical clocks based on routine bloodwork avoid methylation testing, yet still produce estimates rather than diagnoses.
What the Price Band Buys
A 2025 commercial market report from Market Intel put available biological age panels at $149 to $795 per test, with estimated standard errors of about 3.5 to 5 years. A 2026 manufacturer listing for the NOVOS Age at-home kit priced one kit at $349, or $299 per kit when buying two or more.
A test with an estimated error of several years is better suited to tracking a pattern than treating a single result as exact. Repeating a test multiplies its price, and the comparison is most useful when the same assay is used each time.
A strong match to calendar age does not establish that a clock predicts disease. A 2024 preprint on the MethylDetectRAge clock reported a Pearson correlation of 0.91 with chronological age. That shows how closely the model estimated birthdays in the study. It does not, by itself, show how well it predicts disease or mortality.
For a broader comparison of test types, this overview of longevity testing describes the clocks and panels that appear in programme menus. To compare reports, look for the clock name and version, the tissue tested, the assay platform, the reference population, and whether the design is cross-sectional or longitudinal. If a clinic provides two clocks, compare their results side by side. Averaging measures built to estimate different things does not create a clearer one.
When a Precise Clock Still Misleads
“Biological age” can mean three different things: a calendar residual, a mortality marker, or a pace of ageing. A report that gives a precise number without naming which output it measures leaves the reader guessing what the score can support.
A 2022 analysis of epigenetic biomarkers in Clinical Epigenetics illustrates the difference. A one-standard-deviation increase in Hannum age acceleration was associated with a 30% higher mortality hazard after adjustment for clinical and lifestyle factors (HR 1.30, 95% CI 1.07 to 1.57). The corresponding estimate for GrimAge acceleration was 40% higher (HR 1.40, 95% CI 1.06 to 1.83). For Horvath age acceleration, the adjusted association was close to zero (OR 1.04, 95% CI 1.00 to 1.09).
The same study found different associations depending on the clock. That is why a mortality marker should not be presented as a direct measure of how quickly a person is ageing, or as a calendar-age estimate.
A precise clock can still show the wrong time, which is the point of the illustration below.
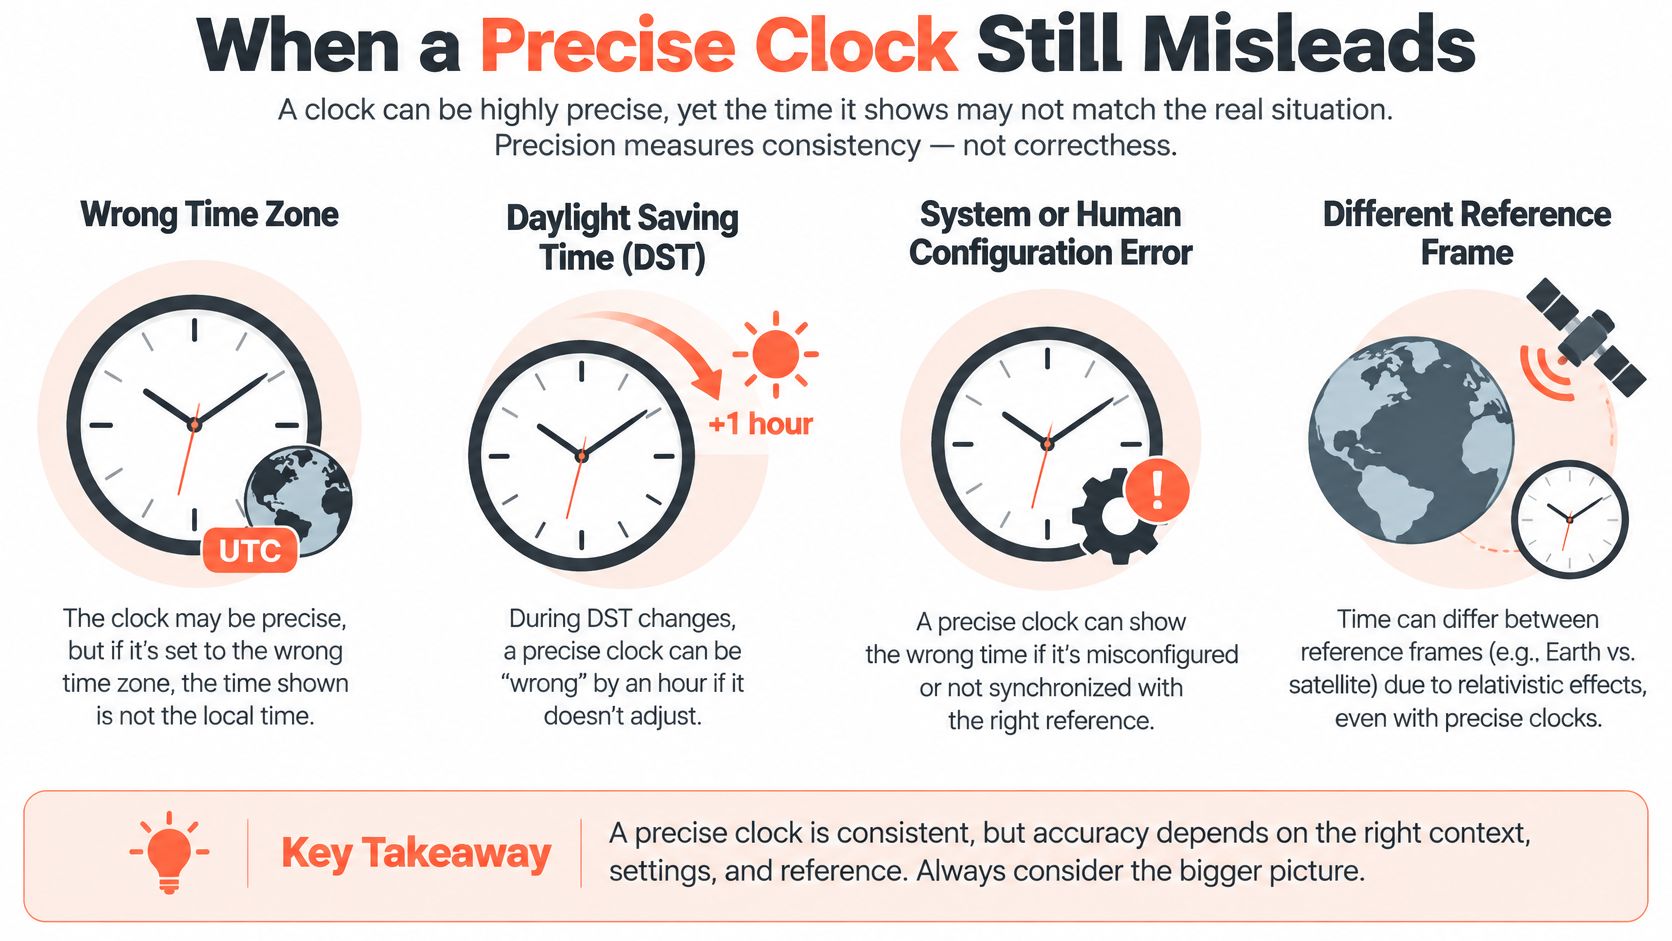
Precision and Biological Meaning Are Different Questions
Analytical reproducibility asks whether a test returns similar results when repeated. Biological validity asks whether the result measures an aspect of ageing that matters. A test can be consistent without answering the second question.
Across more than 22,770 sorted and whole-blood samples from 25 cohorts, stochastic processes accounted for approximately 66 to 75 percent of the predictive accuracy of Horvath’s clock and about 90 percent for Zhang’s clock, with a lower share for PhenoAge, according to a multi-cohort analysis of what clocks capture. In other words, a clock may predict its target partly through statistical patterns, not through a direct measurement of the rate at which someone is ageing.
Technical replicate noise can also be large relative to the small year-to-year changes clinics advertise. A one-year shift may reflect the measurement process rather than a durable change in ageing rate.
Blood-cell composition, acute illness, changes in smoking or medication, and a different laboratory, extraction method, array, or clock version can all move a score. A useful report names the assay and clock version, explains how uncertainty is represented, and specifies whether repeated results can be compared on the same testing pathway.
A benchmark for comparing programmes: look for independent validation, a defined outcome, calibration across populations, and evidence that changes over time predict health. Lower measurement error may improve precision, but it does not by itself establish clinical meaning.
The guide to grading longevity evidence puts the outcome before the precision. A report should name whether its result is a calendar residual, a mortality marker, or a pace measure, then explain what that output can and cannot establish.
What One Result Means for You
A hazard ratio describes thousands of people. Your report describes one blood draw on one Tuesday morning.
A result that feels like good news is still a number with an error band.

Why one draw can’t act as a diagnosis. A review of individual-level clock reliability argues that epigenetic clocks aren’t yet reliable at the person level, for four reasons that show up in every clinic: substantial variability between single timepoints, tissue-specific methylation patterns, no validated thresholds separating a meaningful result from normal biological variation, and genuine difficulty telling whether a later change reflects ageing, illness, or lab drift.
Put a scale on the headline. The same review notes that even a newer seven-biomarker clinical clock reported a mean absolute error of about 4.01 years in UK Biobank data. So a result phrased as “eight years older” can sit inside measurement and biological scatter. It’s a flag worth investigating, not a deficit you can spend.
Illness moves the number fast. In a 2024 study using transcriptomic data from 463 healthy individuals, acute COVID-19 infection increased measured transcriptomic age by as much as 24.47 years, as reported in the bioRxiv preprint on transcriptomic age. That isn’t ageing. It’s an immune response showing up in the model. Don’t buy, repeat, or panic over a panel taken during an infection, a new prescription, or the week you stop smoking.
The Repeat Rule
Same laboratory, same tissue, same extraction method, same array or sequencing platform, same clock version, and comparable health at both draws. Change any of those and part of your result is workflow. Book the repeat for a week when you’re well, off new medications, and have been sleeping normally.
Decision rule: a biological age score adds information when it’s read beside blood pressure, metabolic markers, fitness, disease screening, and a validated risk score, and when the clinic can name the outcome its algorithm was trained on. If those conditions don’t hold, treat the result as motivation or as research participation, not as a reason to start, stop, or buy a treatment.
What would justify another test? A clock chosen in advance, a confidence interval published with the result, and a change larger than the assay’s known error, interpreted against a clinical outcome rather than against the score alone. Without those three, you’re paying to watch noise.
Accuracy Across Ancestry and Circumstance
A biological age result can combine three different signals: a calendar residual, a mortality marker, or a pace of ageing. Ancestry and social circumstances can affect how well each signal applies to you. A useful report names its output and explains who the clock was tested on.
The reference population is part of the measurement, not a footnote. A systematic review found that epigenetic clock studies generally report sociodemographic characteristics poorly, making it difficult to judge whether a clock transfers to people unlike its training sample, according to the review in Evolution, Medicine, and Public Health. When the reference group is unclear, a gap from the reported average may reflect calibration error as well as biology.
Social circumstances can shape clock results too. Lower socioeconomic status has been associated with faster clock-measured ageing. Stress, deprivation, discrimination, smoking, pollution, and unequal access to healthcare may contribute to these patterns. A score cannot, by itself, separate those exposures from other influences on ageing.
Six disclosures to look for when judging a personal gap:
- Training-cohort ancestry. If people with your ancestry were not represented in the training data, the estimate may not transfer reliably.
- Sample type. Blood and saliva are different inputs. A clock trained on one may not perform the same way with the other.
- Assay platform. Array version and processing pipeline can affect results. A repeat using a different platform may not be comparable.
- Sex and age balance. If the training cohort is skewed towards one sex or age group, ask how the result was validated for others.
- Calibration population. Ask which group defines the “normal” range.
- Subgroup validation. Look for evidence that the clock performs well in groups like yours, not just in the overall sample.
A socially patterned score should not be used to ration care, label someone biologically inferior, or suggest that an expensive intervention can reverse structural causes of a faster clock.
If a result looks accelerated, consider whether social exposures or calibration limits could help explain it. The score is a measurement, not a personal failing, and a membership is not proof that those causes have been reversed.
Choose a Report Minimum Before You Pay
Turn the quote into a pass or fail. Seven items, checked before any money moves.
The checklist below is what separates a report from a receipt.
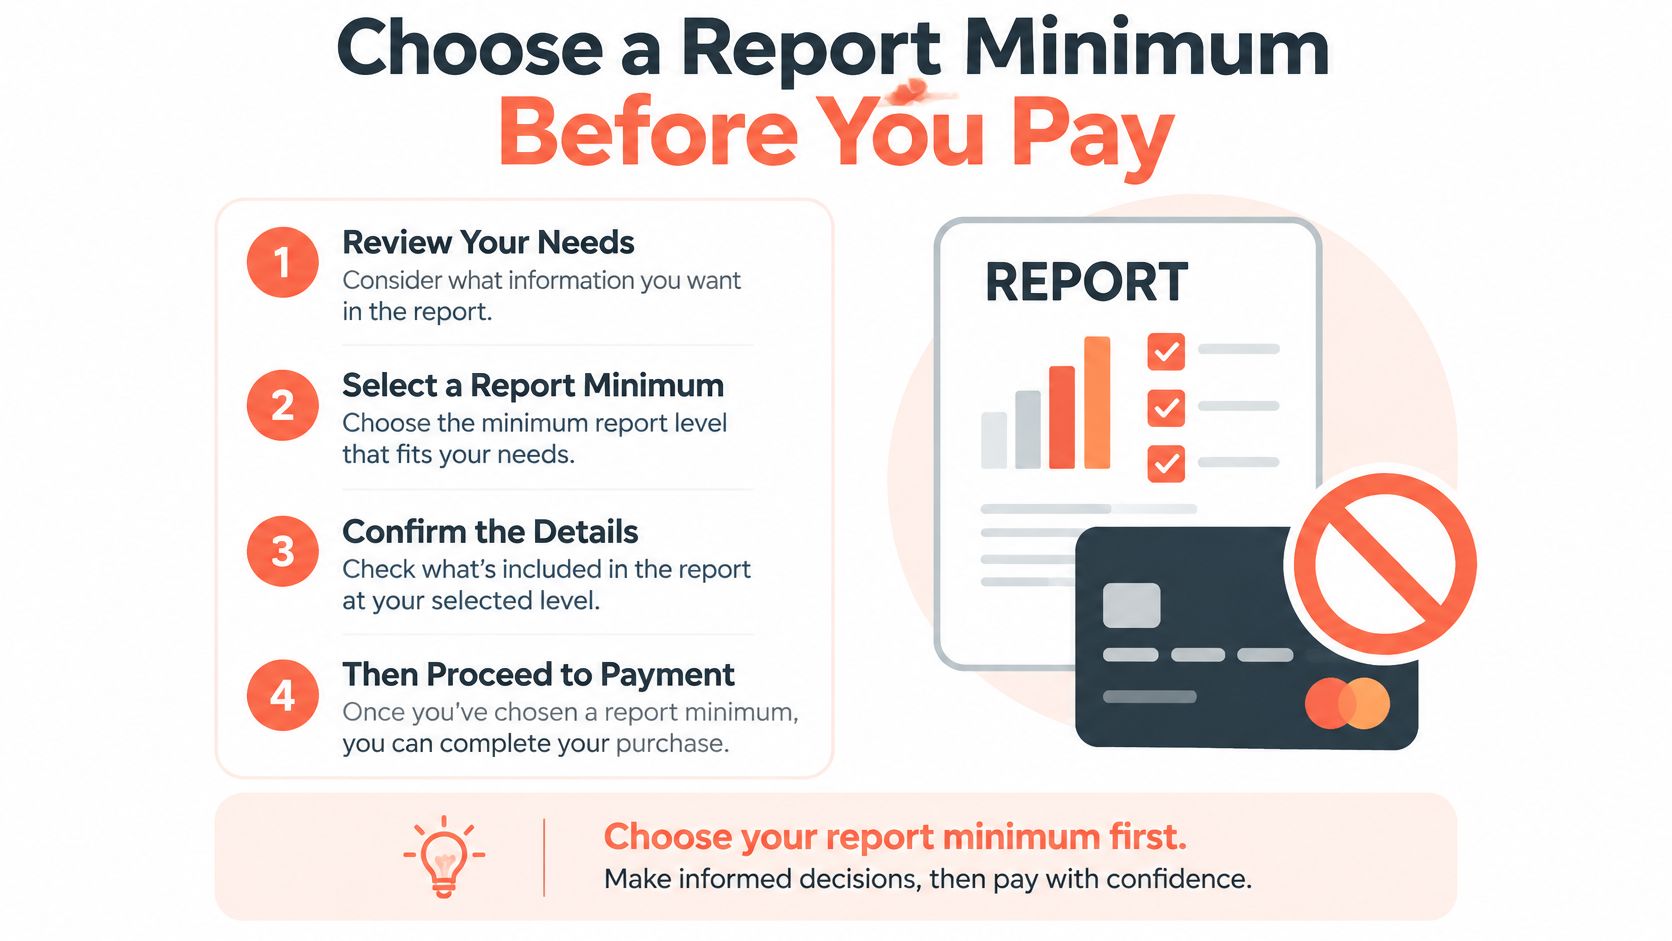
| Report item | Minimum to require | If it is missing |
|---|---|---|
| Clock and version | Named algorithm, not the phrase biological age | You cannot tell calendar, risk, and pace apart |
| Tissue and platform | Same lab, tissue, and array for any repeat | A later change may be workflow, not biology |
| Reference population | Ancestry, sex, and age balance disclosed | The gap may be calibration error |
| Uncertainty | Confidence interval, or an error band stated in years | A one-year claim is stronger than the assay |
| Output type | Calendar residual, risk marker, or pace named | A pace may be sold as years younger |
| Timing | Not drawn during acute illness, a new prescription, or a smoking change | The number can move without a change in ageing rate |
| Decision use | Interpreted beside standard risk markers | The score is motivation or research, not a treatment trigger |
Read the middle column as a contract. A named clock means the clinic can tell you what the algorithm was trained to predict. A tissue and platform commitment means your second result can be compared with your first. A disclosed reference population means the gap between your estimated and chronological age has a denominator you can inspect.
The uncertainty row decides most purchases. A single point estimate with no error band invites you to treat a one-year movement as progress, when the assay’s own scatter is wider than the change. Ask what change would exceed the error, and get the number in writing before the first draw.
We’ve compared 232 tests in building our reviews, and we monitor roughly 150 clinics across Europe, the Gulf, North America and Asia while carrying 19 of them in the directory, which gives a useful sense of how rarely the full disclosure set appears.
Price is the last filter, not the first. Our breakdown of biological age test cost sets out what each format includes and where the recurring spend sits, so a cheaper panel with no named clock doesn’t win by default.
A missing row means the result isn’t ready to change a medication, a supplement stack, or a high-cost membership. Our content is editorial only and doesn’t constitute medical advice, and this checklist is general information rather than a personal recommendation.
Before you pay for biological age testing, send the clinic one question in writing: which clock and version, which tissue, which reference population, and what error band. A vague answer tells you it’s a motivational product with a lab attached. Longevity Clinics scores programmes on diagnostic depth, medical supervision, conflict freedom, and evidence base, and the clinic directory shows which of the 19 listed programmes name their clocks and publish a reference population. Read the diagnostic-depth notes first, then ask the clinic for a sample report before you book the draw.