What Is the Difference Between Life Expectancy and Longevity
Learn what is the difference between life expectancy and longevity, from population averages to healthspan, healthy years and what they mean for you.
Life expectancy is a population average of years lived, 73.3 years at birth worldwide, while longevity describes how long and how well particular people survive.
A country average isn’t a personal expiry date. If a news line says people live to the mid-70s, that doesn’t mean you, or your neighbour, will die at that age. The figure mixes deaths in infancy, midlife disease, and people who reach 90 or 100. What is the difference between life expectancy and longevity comes down to that mix. One number summarises a population’s death rates. The other describes duration, and often function, for individuals and for the upper end of a group.
That gap matters when you plan retirement, care, or a high-cost longevity programme. Healthy years, not the headline average, tell you whether extra time is time you can still use.
Table of Contents
- Life Expectancy Versus Longevity at a Glance
- Why an Average Life Expectancy Is Not Your Expected Age
- How Life Expectancy Rose and Where It Still Differs
- How Longevity Is Measured Beyond Survival
- What Pushes Years and Healthy Years Apart
- Choosing Which Number to Plan Around
Life Expectancy Versus Longevity at a Glance
Life expectancy is a statistical estimate for a population. Longevity describes how long people live and how well they function while they do. The World Health Organization global health estimates put global life expectancy at birth at 73.3 years in 2023, compared with 73.4 years in 2019, so the population average had nearly returned to its pre-pandemic level. That recovery is about death rates across a whole population, not a promise that any one newborn will reach 73.
Five labels get swapped in clinic brochures and headlines. They don’t count the same thing, and only one of them has a single worldwide anchor in current reporting.
| Measure | What it counts | Applies to | Reference value |
|---|---|---|---|
| Life expectancy at birth | Average years a newborn would live if current age-specific death rates stayed constant | A population in one year | 73.3 years worldwide in 2023 |
| Healthy life expectancy (HALE) | Years lived in full health, adjusted for disease and disability severity | A population | No single global figure |
| Longevity | Duration and spread of survival, including reaching age 90 or 100 | Individuals and populations | No single standard figure |
| Lifespan | Age at which a particular person dies | One individual | No single standard figure |
| Healthspan | Years lived free of major disease or disability | One individual | No single standard figure |
Three checks before you compare numbers
Population or a person. A birth figure describes a hypothetical group under one year’s death rates. It doesn’t name your age at death.
Total years or healthy years. Healthy life expectancy adjusts for disease and disability. Two places can look alike on total years and still differ in years lived in full health. There is no single global healthy-life figure to paste beside 73.3, so don’t treat the two as the same kind of number.
Survival or a biomarker. Survival to 90, age at death, and years without major disability are outcomes you can observe. A biological-age score is a lab estimate.
Practical rule: Ask which measure a headline means before you compare any numbers.
A clinic talking about a blood panel and a statistician talking about births aren’t reporting the same result. Line the claim up with one row of the table, then decide whether the number is even comparable.
Why an Average Life Expectancy Is Not Your Expected Age
Picture a room of ten people. Nine are adults aged 40. One is a child aged 2. The average age of the room sits in the mid-30s, and nobody in the room is that age. The average describes the group. It doesn’t describe a person you can point to.
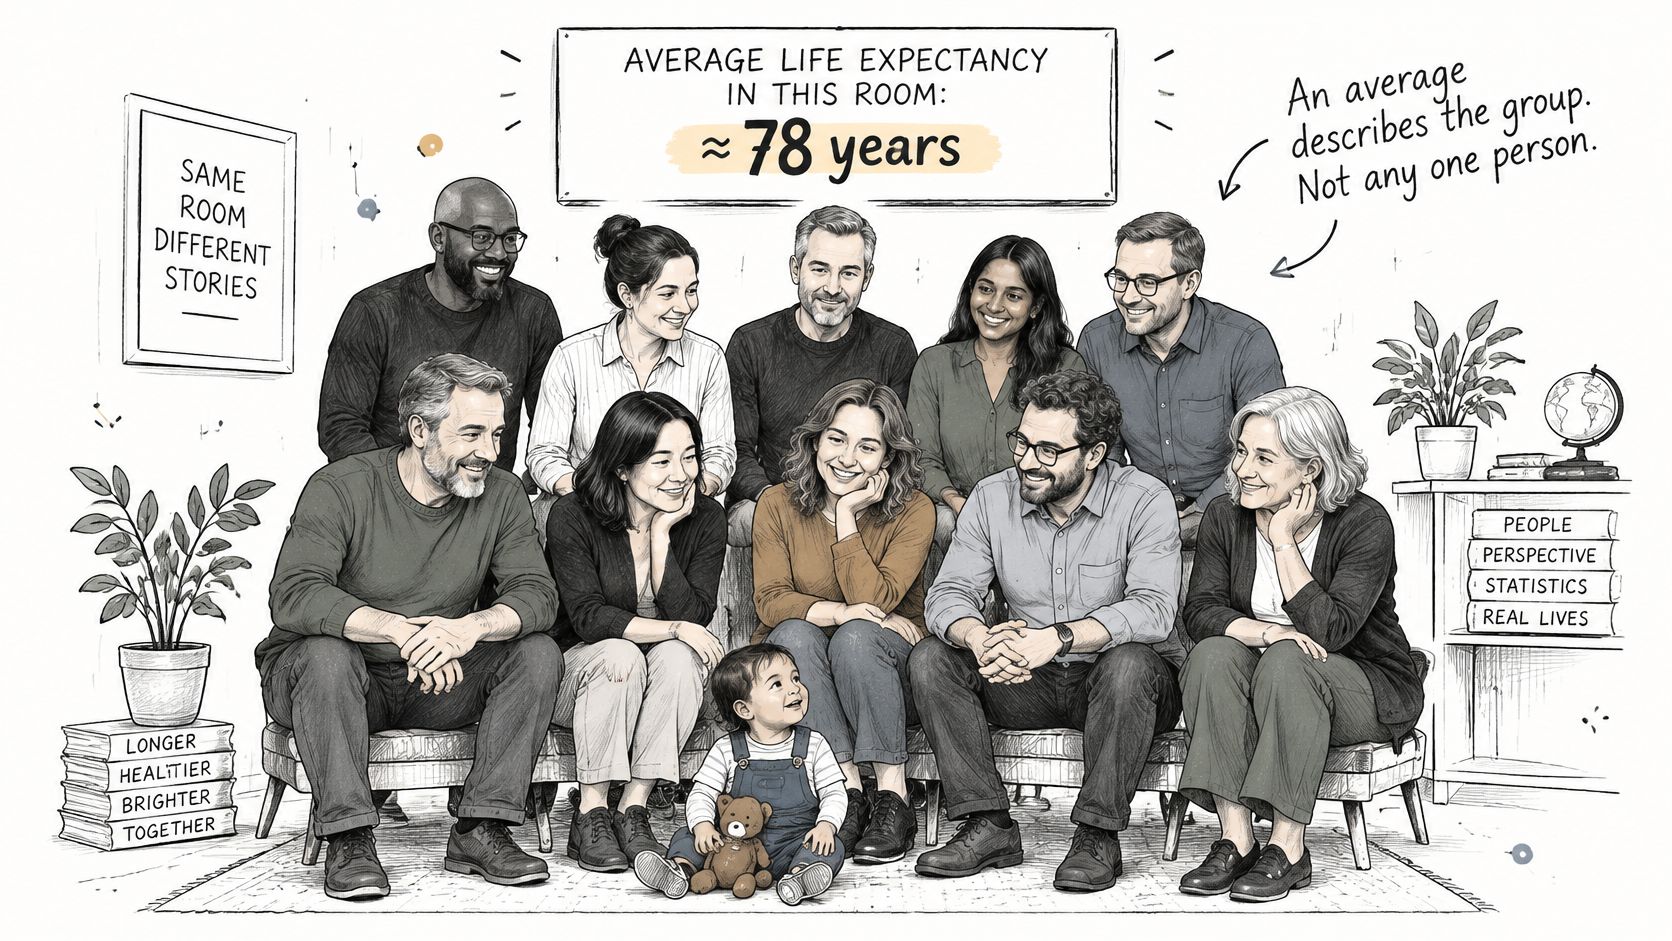
The World Health Organization indicator registry defines life expectancy as the average number of years a person could expect to live if exposed throughout the rest of life to the age- and sex-specific death rates prevailing in a specified place and year. The figure people quote most, life expectancy at birth, is a period statistic. It applies one year’s mortality pattern to a hypothetical population. It doesn’t follow a real group of babies through their actual lives.
Why 80 isn’t an appointment
Say a country posts a life expectancy of 80 years. A baby born there isn’t expected to die exactly at 80. The average is built from deaths in infancy, adulthood, and old age. A few early deaths pull the mean down. Many people who clear childhood live past the printed number. A population can post a high life expectancy without every person reaching exceptional ages such as 90 or 100. Longevity, in that same WHO framing, shows up in survival to those ages, in the maximum observed age, and in how deaths are spread at older ages.
Your own outcome still depends on health, genetics, and the risks you carry. Improving the average, cutting early deaths, adding healthy years, and raising the share of people who reach extreme ages are related jobs. They aren’t the same job.
Ask of any average which group it covers and which year’s death rates it uses.
Life expectancy calculated at age 65 is a closer personal reference than the birth figure, because it counts only the years still ahead of someone who has already survived childhood and midlife. It is still an average for people of that age and sex in that place and year. It isn’t a forecast with your name on it.
How Life Expectancy Rose and Where It Still Differs
Global average life expectancy at birth rose from about 32 years in 1900 to about 71 years in 2021 and roughly 73 years in 2023, according to Our World in Data’s historical series. That is more than double the 1900 figure. The climb does not mean the typical person in 1900 died at 32, and it does not mean everyone today dies at 73.
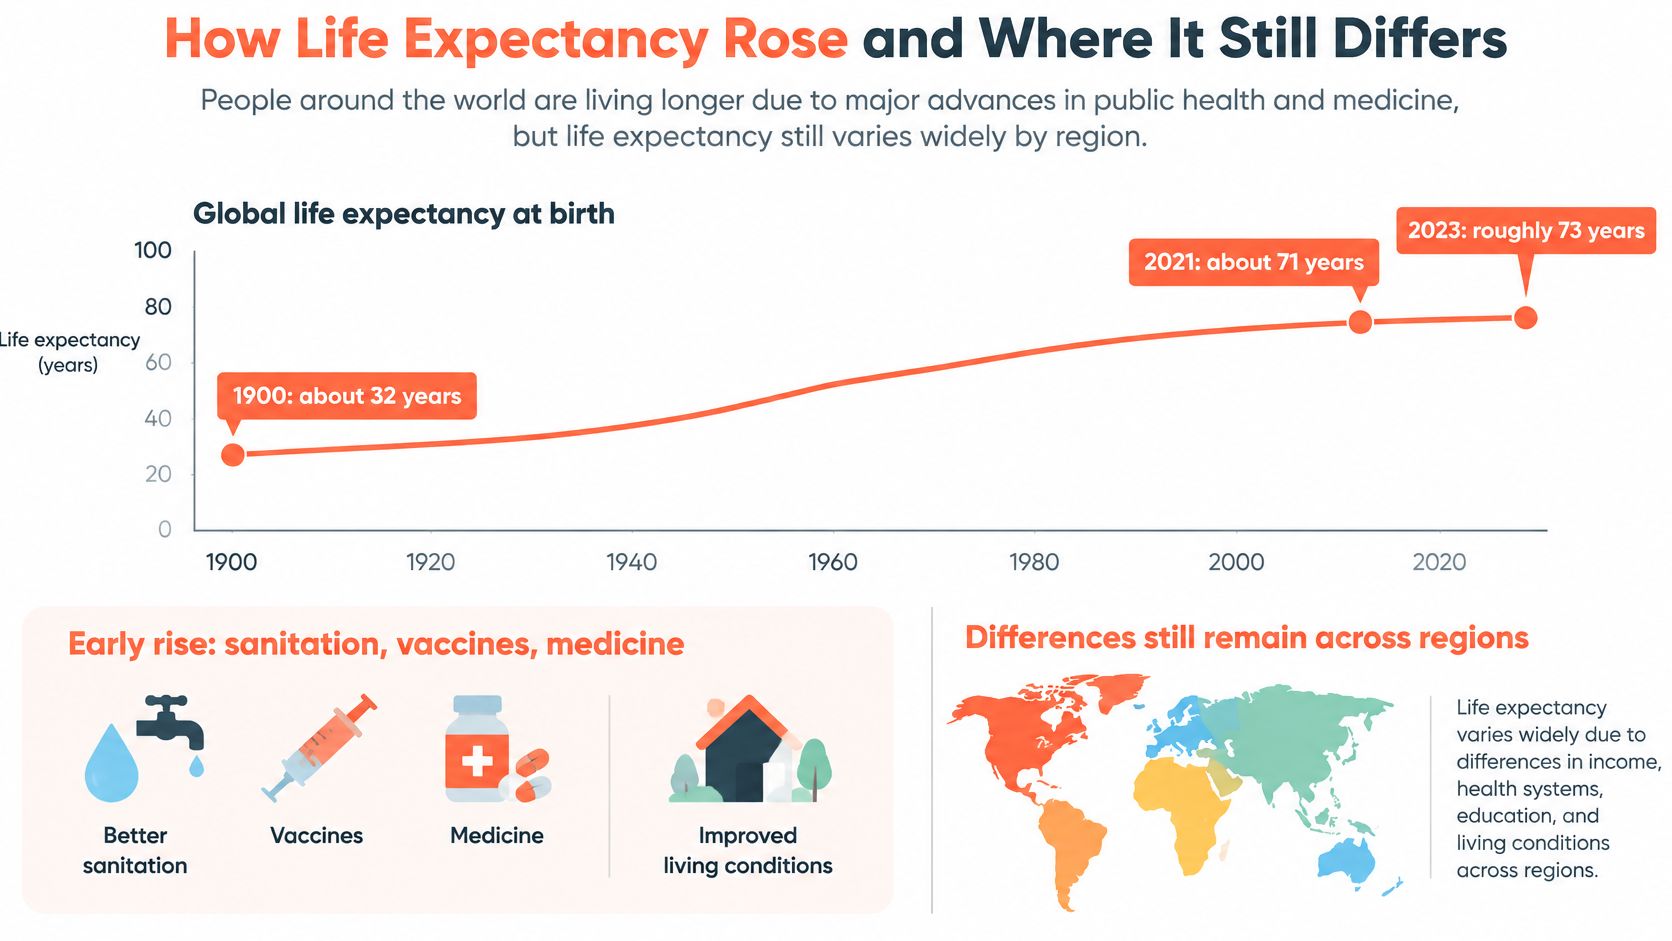
High infant and child mortality pulled the early average down. As those early deaths fell, the average rose sharply. Gains also appeared at older ages, so the change is not only a story about childhood. The printed series is still a period measure: the pattern you would get if that year’s age-specific death rates stayed constant. It says nothing about the maximum human lifespan, and nothing about how old the longest-lived individuals become. Longevity asks how many people reach very old ages and how far that upper tail extends.
The spread that a world average hides
National life expectancy varies widely, and country-level figures from the same Our World in Data series show the range. A single world figure cannot stand in for a high-income country with low infant mortality and a country where early deaths remain common. Place still dominates the number. A world average is a summary, not a forecast for your street.
The United States sits in its own recent band. The National Center for Health Statistics reported life expectancy at birth of 78.4 years in 2023, up 0.9 years from 77.5 years in 2022.
| Measure | Place | Year | Value |
|---|---|---|---|
| Life expectancy at birth | World | 1900 | about 32 years |
| Life expectancy at birth | World | 2021 | about 71 years |
| Life expectancy at birth | World | 2023 | roughly 73 years |
| Life expectancy at birth | United States | 2022 | 77.5 years |
| Life expectancy at birth | United States | 2023 | 78.4 years |
The rise also says little about how many of those added years are healthy. A country can gain years of life while gaining years lived with illness or disability.
When a clinic quotes “people now live into their 70s” as if that were your outlook, check the year and the country first. A 1900 world average, a 2021 national figure, and a 2023 United States figure answer different questions. Families weighing later-life support can explore care planning with Velma alongside those population figures, then separate average years from the chance of reaching a very old age in good function. A precise user of these terms keeps lifespan, healthspan, and death risk at each age on separate lines.
How Longevity Is Measured Beyond Survival
For a person booking a programme, the split that matters is lifespan extension versus healthspan extension. More years is one claim. More years free of major disease or disability is another. The World Health Organization’s healthy life expectancy indicator combines mortality with morbidity and estimates years lived in full health, adjusted for disease and disability severity. Two populations can share a similar life expectancy and still post different healthy life expectancy. People may live the same number of years while spending different shares of later life with disability or chronic illness. That difference is the quality gap between total expected years and healthy expected years.
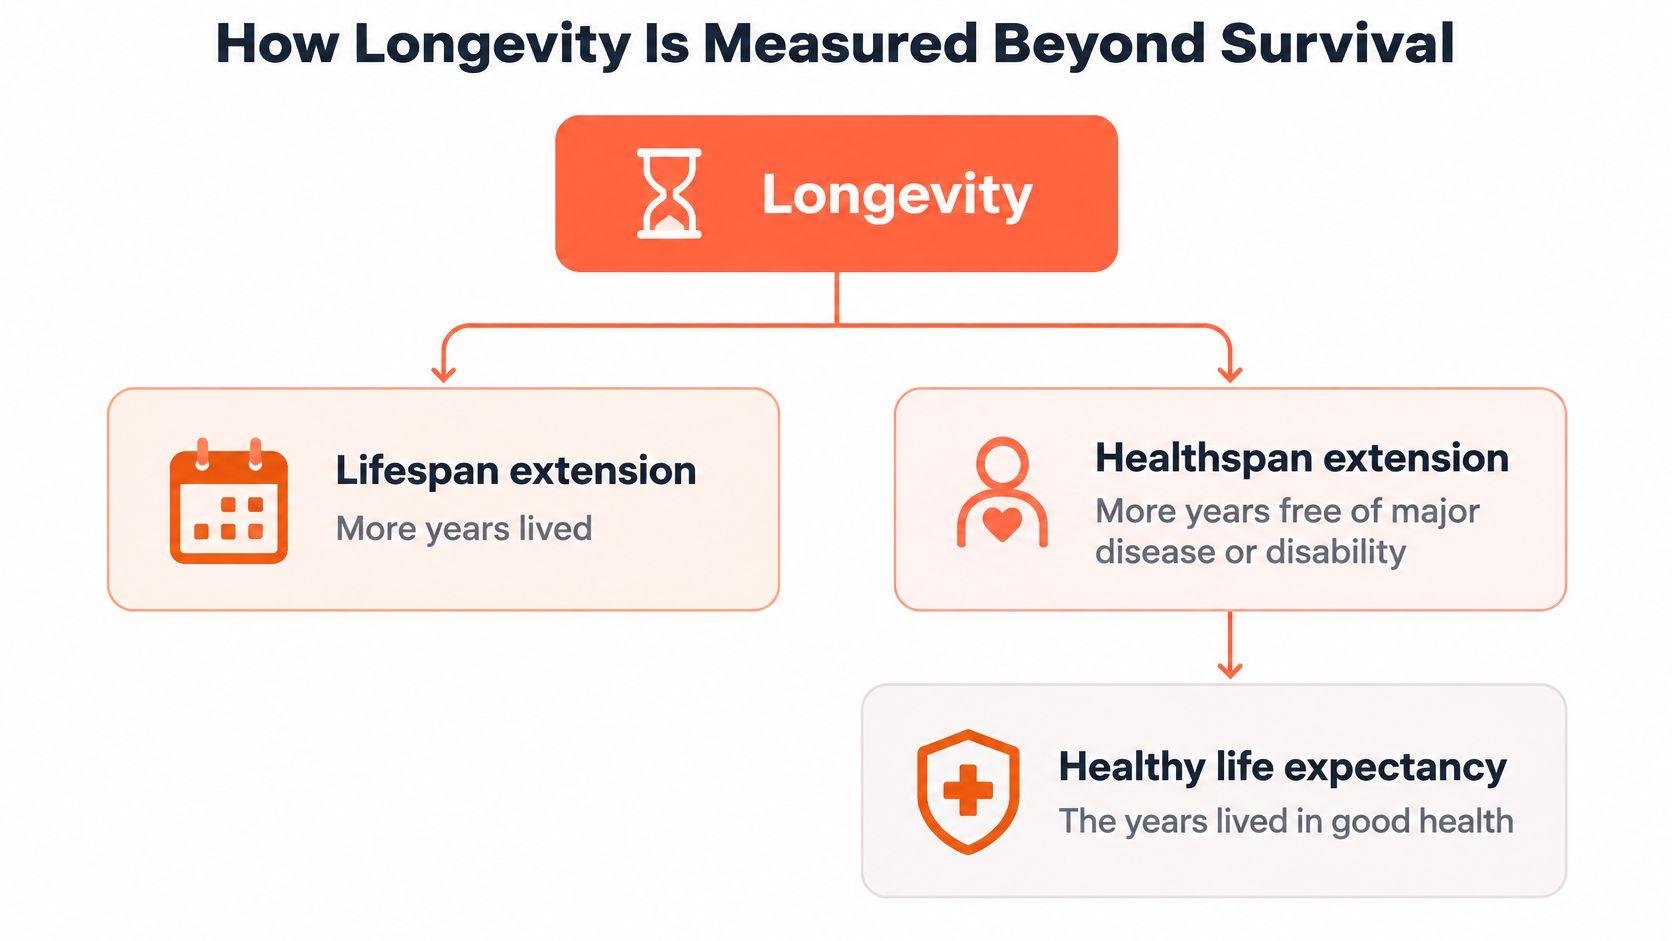
Longevity isn’t one standardised statistic. It covers how long survival lasts, how that survival is spread, including survival to advanced ages, and, depending on context, whether health and function hold up. A reported “increase in longevity” only means something when the endpoint, the follow-up, the comparator, and evidence of less illness or fewer deaths are all explicit.
What a credible outcome report contains
Don’t stop at a composite biological-age score. Ask for outcomes that separate survival from function.
| Outcome measure | What it separates | What it tells the reader |
|---|---|---|
| Disability-free survival | Survival without disability | Whether added years are functional years |
| Validated physical-performance measures | Current function | Whether strength and mobility change |
| Incident disease and hospitalisation | Disease onset and care use | Whether morbidity actually falls |
| Adverse events | Harm caused by the intervention | Whether benefit outweighs risk |
| Biological-age score alone | Biomarker estimate | A surrogate only; it doesn’t prove a longer or healthier life |
Read any claimed gain with four questions. What endpoint moved, years alive or years without disability? How long were people followed? Who was the comparison group? Did illness or death fall, or did only a marker shift?
A biological-age score can be part of a workup. On its own it doesn’t prove you will live longer or spend more years well. Some clinics, including programmes that publish longevity evaluations at Yoyime Clinic, frame assessment around function and risk rather than a single score. Our guide to longevity testing walks through what those panels tend to include. We collect publicly available material on each clinic, from the website, regulator records, peer-reviewed literature, and professional registries, score it against a four-axis rubric, and have physicians and editors check every result. That process tells you what a programme publishes. It doesn’t replace the four questions above.
What Pushes Years and Healthy Years Apart
Two people both reach 85. One spends the last decade with serious limits on mobility and needs help with daily tasks. The other stays independent until the final years. Both sit inside the same life-expectancy average. Only the years lived free of disability separate them.
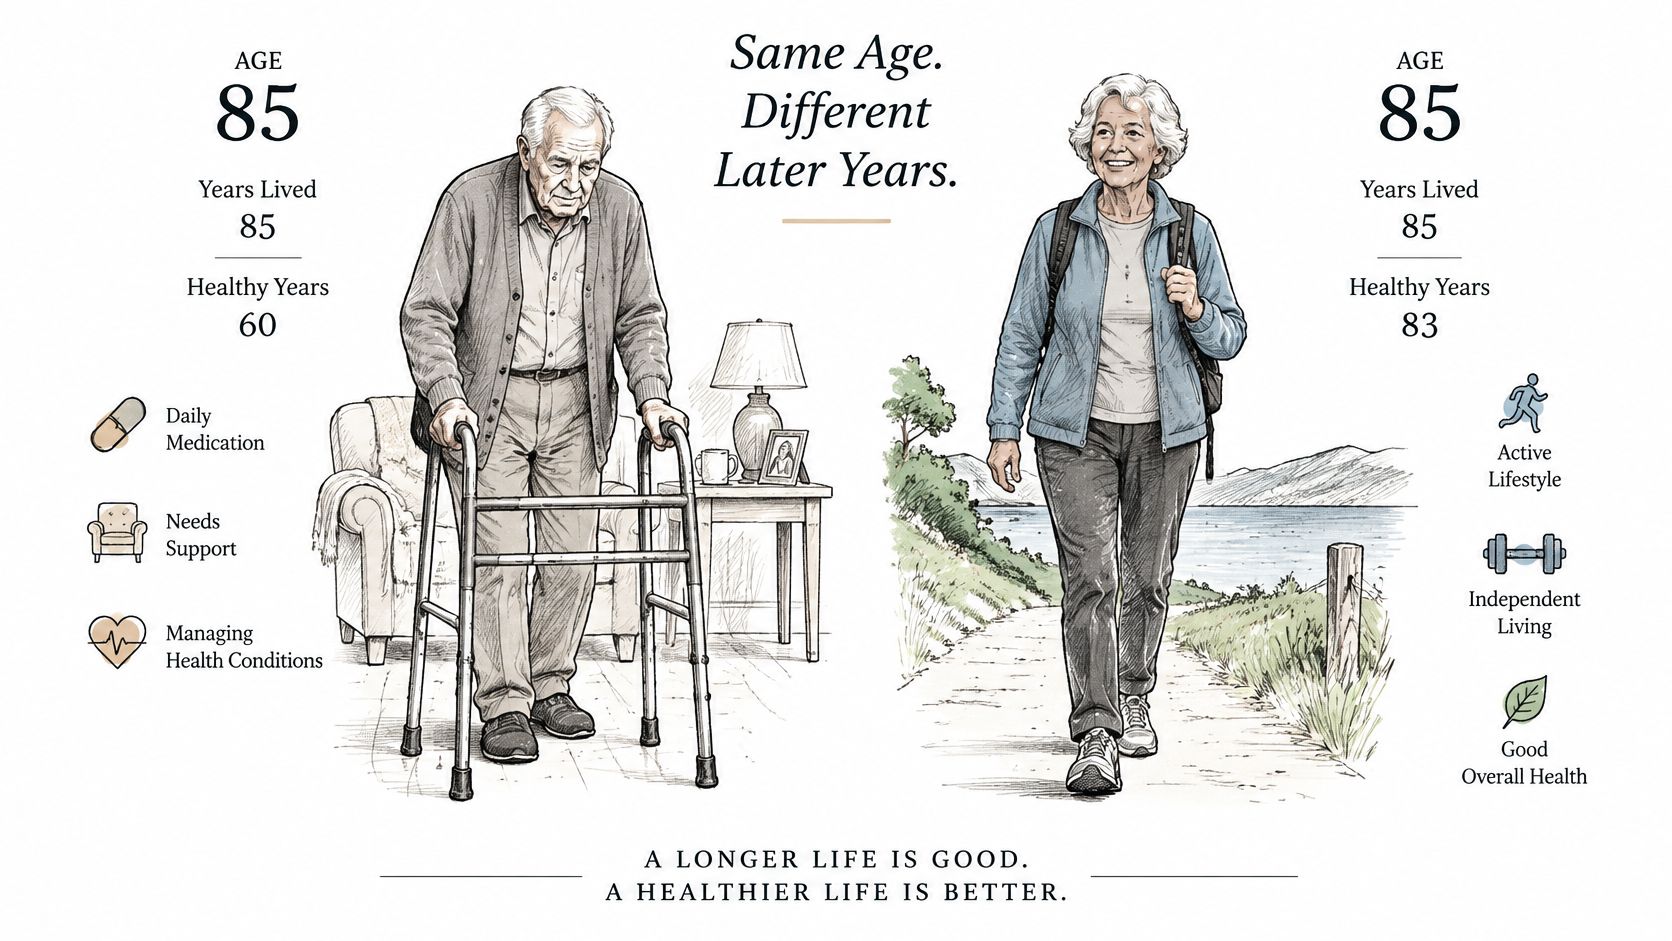
A longer life doesn’t automatically mean a healthier one. Our World in Data’s life-expectancy series, drawing on UN figures, puts the worldwide average at 73.3 years in 2023. That average counts deaths, not the quality of the years before them. Healthy life expectancy is the companion measure. It estimates years in full health after illness and injury are subtracted. A population average works like a doorway height: it describes the group passing through, not whether any one person will need to duck.
Three outcomes often get mixed together: delaying death, delaying disability, and improving current function. Each needs its own endpoint and its own follow-up. A clinic can move a biomarker tied to future risk and still fail to extend total survival or healthy years. That is why a single number rarely settles the question.
Drivers that widen or narrow the gap include:
- Cardiovascular disease, hypertension, and diabetes: These shape both the chance of an earlier death and the years spent with limits.
- Smoking, inactivity, obesity, and poor sleep: Long-term smoking acts across decades. Activity and sleep can shift how you function within months. Regular movement is one of the levers covered in our note on exercise and health.
- Social isolation, early-life conditions, and unequal access to care: Early conditions cast a long shadow. Access decides whether a treatable problem stays treatable. Food patterns sit in the same daily layer, and nutrition habits that support metabolic health are one place to start that conversation with a clinician.
Pick the two or three drivers that apply to you. Those are where healthy years are most likely to be gained or lost. Take that short list to a physician. Don’t act on a single biomarker.
Choosing Which Number to Plan Around
For personal planning, plan around healthy years, not total years. The aim is a longer stretch of good function, not a higher average on a national chart. Population life expectancy is background. It tells you the death rates of a place and a year. It doesn’t tell you whether you will climb stairs, travel, or manage daily tasks in your 80s.
Set goals you can notice. Mobility, independence, and fewer new diagnoses are clearer targets than “beating the average.” Sleep, strength, and blood pressure belong in that list because you can track them with a clinician over months, not only over a lifetime. If a programme sells a longer life, ask whether it means delaying death, delaying disability, or improving how you function now. Then ask for the endpoint, the length of follow-up, the comparison group, and the harms. A marker that improved for eight weeks, with no function measure and no safety report, hasn’t answered the question you came in with.
What an independent review can and can’t do
We publish independent editorial reviews of longevity programmes. The writing is researched by journalists and editors with medical reviewers, and it is not medical advice. We can’t give you personal medical advice or recommend a clinic. We also can’t take booking or pricing questions. Those go straight to the clinic. Before any intervention, talk with a physician who knows your history. A structured look at preventive health screening is a better starting point than a package built around one score.
Plan around healthy years, and judge any programme by the outcome it actually measures.
If you’re comparing high-cost programmes, start with the outcome each one claims, then read how we score published programmes on diagnostic depth, medical supervision, conflict freedom, and evidence. Bring the short list of your own drivers to your physician before you book anything.